Modeling and Diagramming Techniques
CHAPTER SYNOPSIS
Much has been written about the modeling process, and in fact most prominent development methodologies incorporate modeling in some form or other. Implied in each of these methodologies is that their models can be applied to the entire analytical process. In our view, this is not the case. Each of these differing modeling techniques is aimed at a different portion of the analytical process.
The analyst should be familiar with the major modeling techniques and with their most appropriate application. Because it is one of the newest and least-documented modeling techniques, we will give particular emphasis to the entity-relationship model. This chapter will address some of the other modeling approaches and provide some simple, easy-to-use guidelines and procedures for building the various major models.
Modeling and Diagramming Techniques
A definition
A model is a representation, either graphic, narrative, or both, of a physical or conceptual environment. It must identify the major components of the environment, describe those components in terms of their major attributes, depict the relationships between the components, and describe the conditions under which the components exist and interact with each other. A model should depict in graphic and narrative form, the entities and their relationships within the application environment. A model can be composed of several independent or interdependent sub-models.
Much has been written about the modeling process; in fact most prominent development methodologies incorporate modeling in some form or other. Each of these methodologies implies that their models can be applied to the entire analytical process. In our view, this is not the case. Each modeling technique is aimed at a different portion of the analytical process.
Some models are most applicable to modeling data, some to modeling processes, some to modeling work flows, and some to modeling the decision-making process. Attempts have been made to modify some of these models for areas of analysis other than those for which they were initially designed. By and large these attempts have not been overly successful. The analyst should be familiar with the major modeling techniques and with their most appropriate application.
The Entity-Relationship Model
One of the newest modeling techniques, and one of the most powerful is the entity-relationship model, or entity-relationship diagram,which is the modeling technique employed by the Entity-Relationship approach to analysis and design. The majority of the current literature references concentrate on the associated modeling technique which is the heart of the methodology. Moreover, these references concentrate on using the approach for building data models. These data models because of their orientation, are uniquely suited to the development oof database logical models in the hierarchic, network, and relational environments The entity is equally suited to all three because of its real world approach tto data
The 1976 paper in which Dr. Peter Chen described the analytical basis for the entity-relationship approach aalso included a description of the modeling technique which is an integral part of the method. The multilevel analysis portion of the entity-relationship approach produces a series of environmental definitions each one of which is accompanied by a diagrammatic rrepresentation ofthat level. These diagrams are simple clear pictures of the environment in terms which any user can understand In fact user input is an integral part of the diagram creation process.
Entity-relationship models are not data structure models. And, although at their most detailed level they contain and identify data elements, they are not data processing models. They are business models, and as such, they model business environments and depict business components.
Entity-relationship diagrams (also referred to as models) consist of representations of the various levels aand parts of the organization, from the strategic to the operational level. Each model of a level represents the entities and relationships from the perspective of that level, and within a level the entity-relationship models represent the perspective of one or more particular users at that level.
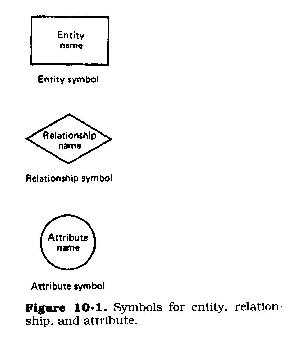
Although there are numerous variations of the entity-relationship approach mmodel notation the three basic notation components of the entity-relationship model are symbols representing an entity, a relationship between two entities, and the attributes, or descriptors, of either entities or relationships.
These symbols are (see Figure 10.1)
Entity-relationship (ER) models have been applied to individual business units, and even to individual business functions. The full ER approach model addresses the whole organization and each of its parts ina top-down manner. Only by using this top-down approach with levels can the full business perspective be attained. The approach develops tthe models in pyramid fashion, beginning with the whole firm and proceeding downward. This corresponds most closely to the manner in which most firms view themselves.
We will present the models in the sequence in which they are most easily developed, aa sequence which corresponds to the three levels of the organization: strategic, managerial, and operational.
The entity-relationship approach produces a different type of diagram or set of diagrams for each of the three basic organizational levels.
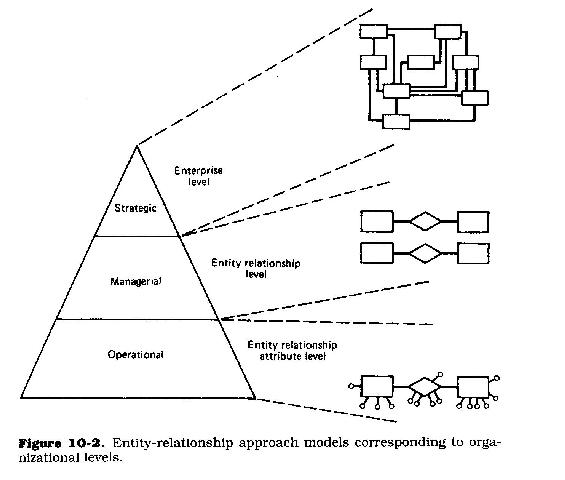
Because it is a top-down approach, the contents of the diagrams at each successively lower level represent a decomposition or expansion of detail of the level immediately preceding (see Figure 10.2). The number of diagrams at each level is dependent upon the number of entities and relationships involved and on the complexity of those entities and relationships There is no requirement that diagrams be maintained on a single chart, or that they have to be broken down into many smaller charts.
Aside from the enterprise-level model, which should be a single chart, and by definition a firm-wide chart, the lower level charts may be developed against aany perspective These perspectives may be firm-wide, or by function, business unit, or product line. Because they are designed to be an aid for analyzing and understanding the business environment, the diagrams at each level can be combined or split in any manner which aids comprehension, but above all they should be drawn in such a way that they are easy to follow and meaningful to both analyst and developer.
The Enterprise Level
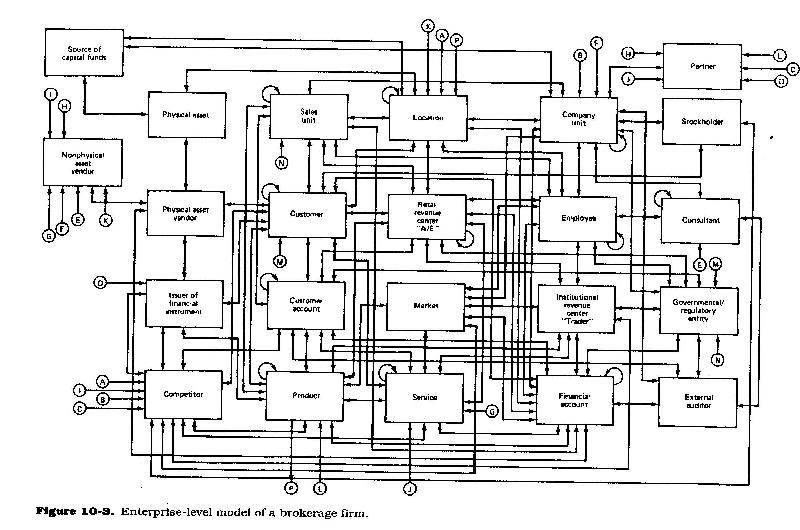
Level one, the enterprise level, consists of an identification of the major entities of the firm and an indication as to whether a relationship exists between them. There is no differentiation among the various subtypes of any given entity nor any indication of the number or types of relationships between any two entities. The entities and relationships are represented in binary state, that is they either exist or they do not. At this level only the major entity classes are named. By definition there can only be one enterprise-level model. See Figure 10.3 for an example of an enterprise-level model of a brokerage firm.
Every firm,large or small, deals with many different types of entities in the course of conducting its business. Although the names of the various entities will vary from firm to firm, at the most generallevel they can be grouped into four major categories: people, places, physicalthings (such as a document, a product, a machine, etc.), and logical or legal things (such as a corporation or a business unit). Using these four major categories, we can identify some of the most commonly occurring entities regardless of the type of business a company does.
People entities fall into three major classes: (1) the people who make up the firm's work force, (2) the people who are its customers or clients, and (3) the people who supply it with raw materials, products, parts, and financial or otherservices.
Place or location entities also fall into three major classes: (1) the places where its services are offered, or its products are made, stored, and/or sold, (2) the places where its work force is located, and (3) the places where its customers reside or are otherwise located.
Physical thing entities include: the actual products of the firm; its physical assets (buildings, land, furniture, machinery or other equipment, inventory, supplies, etc.); its financial assets (money, securities, leases, contracts, bank accounts, loans, notes, credit lines, etc.); and the documents, memoranda, accounts, contracts, orders,invoices, statements, checks, vouchers, reports, and files which record its business transactions and activities.
Logical or legal thing entities include: the services offered by the firm; the firms that are its customers or clients; the firms or people who supply it with raw materials, products, parts, and financial or other services; the markets within which the firm operates; the governmental and regulatory units under whose jurisdiction the firm operates; and the organizational units into which the firm's work force is grouped for business, functional, and reporting purposes.
Within any given firm it can be expected that most, if not all, of the above entities will be represented. What they are called, how they are defined and described, how they are sub-typed, and, more important, what the firm needs to know about them depends upon the specific business of the firm; its culture; and the business rules, policies, mission statements, charters, and procedures which govern what it does and how itoperates.
It should be remembered, however, that the business entities being identified and defined at the enterprise level relate to the firm as a whole. As such these entities and relationships may be numerous and complex and may lack the precision of definition which lower level models require.
The enterprise business model depicts entity classes. At the class level the entities have the widest possible definition and scope while, still maintaining the general physical and role characteristics of the individual entities of which they are composed. These entity classes are treated as if there were no variations in type and as if each of their component entities were defined and behaved in a similar manner.
At the enterprise level
Business entities are portrayed at a class or universal level. There is no differentiation between the various subtypes of a given entity, unless those differences have meaning at a firm-wide and a functional level.
The creation of the enterprise-level diagram is a two-step process.
Step 1 is to identify, select, and name the relevant entities. It is helpful, although not mandatory, to select a primary or core entity to begin the model. In most cases this core entity will be either the customer, product, or employee, or all three, since normally these are the most important entities to the firm. These entities are placed in the center of the page.
All entities directly related to that core entity are placed, one at a time, in a ring around the core entity. They will be called secondary entities only for purposes of describing the model creation process. As each entity is drawn, its name should be placed within the entity symbol. This is the entity's primary name (the name of all entities in the class) or its role name (the name of the entities in the sub class being depicted).
Step 2 is to connect each pair of related entities with a single line between them. This line contains no name or other information. Although a specific entity may be related to many other entities, each entity must be related to atleast one other entity within the model.
The Entity-Relationship Level
Level two, the entity-relationship level, is an expansion of the enterprise level. At this levelthe entities which were previously identified only at the class level can now be brought into sharper focus. This level recognizes and names both the different subtypes of the major entitiesand the various distinct relationships which exist between them.
All models below the enterprise-level business model are more detailed and may use any of a number of distinct entity subtypes or subsets of the universal entity set in place of the universal entity set. Here, each sub-set is given a name corresponding to either the entity subtypes which populate it or to the role which the subset member entities play within the firm.
These names are usually something other than that of the entity name assigned to the universal set. These subsets are usually created to represent the various roles which the more global entityplays.
In some cases the subset name is different from the role name and may represent the title by which the members or principal members are known within the firm. In these cases, both the role and title names by which that entity is known should be stated.
At the managerial level
The creation of the entity-relationship level diagram is also a two-step process.
Step 1 begins with the major entities represented at the class level on the enterprise-level diagram and differentiating them into their meaningful components, subtypes, subclasses,etc. It is here that the various typesof customers are differentiated, as well as the various types of products,employees, accounts, etc.
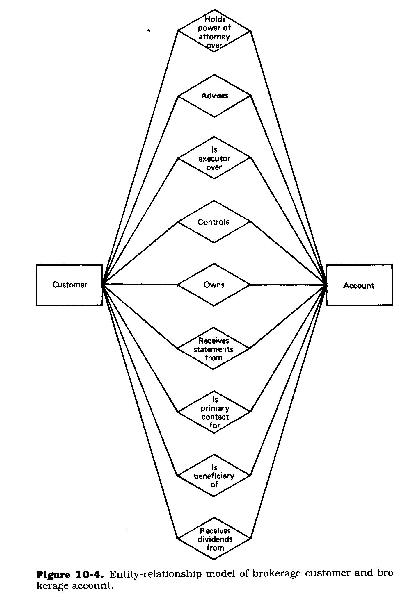
Step 2 is to define each of the relationships between each primary entity and its related secondary entities. Each distinct identifiable relationship should be represented using a relational shape connected on one side to the primary entity and on the other to the secondary entity with which it is related. Therelationship symbol should contain the name of the relationship type (Figure 10.4). Each secondary entity should be connected to every other secondary entity to which it is related in the same manner as the secondary entity was connected to the primary entity.
The above procedure should be repeated adding in third-, fourth-, fifth-level entities,etc., as appropriate. In each case, any significant relationships between each new entity and any previously drawnentity should be added as above.
The Entity-Relationship-Attribute Level
Level three, the entity-relationship-attribute level, is similar to the level two diagram with the exception that named attributes areadded to both the entity and the relationship symbols.
For the entities, each attribute represents some grouping of data which is necessary from a business perspective to describe a physical or logical characteristic of the entity or to describe some activity of the entity. For the relationships, each attribute represents some grouping of data which is necessary from a business perspectiveto describe, qualify, or maintain the named relationship between two entities.
The creation of the entity-relationship-attribute diagram uses the entity-relationship diagram as its starting point. Until this point the models have only identified the entities and relationships by name and context. For a given entity or relationship little is known about it other than its name and the obvious fact of its existence, and the fact that the firm isinterested in it.
At thisthird level, we describe these entities in terms of their attributes or characteristics. In other words,beyond knowing that the entity exists, we must also know what the entity looks like, how it is identified, and what it does. These descriptors or characteristics are called attributes. An attribute is thus some distinct aspect of the entity or relationship and is necessary to describe the entity or to qualify the relationship. The full description of an entity or a relationship consists of the full set of attributes which describes it.
For an attribute to be significant it must relate directly to the entity or relationship, be completely dependent on the entity or relationship for its existence and meaning, and be definable in terms of one or more data elements. It is immaterial as to whether one or more data elements exist in an attribute, as long as the attribute applies to all instances of the entity or relationship being represented. Seen another way, an attribute is some distinct category of mutually related data, the sum of which describes something of interest about the entity or some qualifier about the relationship between two entities.
The creation of an entity-relationship-attribute diagram is a multiple-step process.
Step 1 begins with the extraction of each entity from the ER diagram and its placement on a separate page. Each identifiable attribute of that entity that is represented by an attribute symbol should be drawn below the entity symbol and connected to the entity by a single line.
As each attribute is drawn, its name should be placed within the attribute symbol. As each attribute is identified and named, it should be annotated with adiscrete number or n (denoting some unknown number greater than 1) to indicate how many occurrences of this attribute would necessary to describe the entity (Figures 10.5 and 10.6).
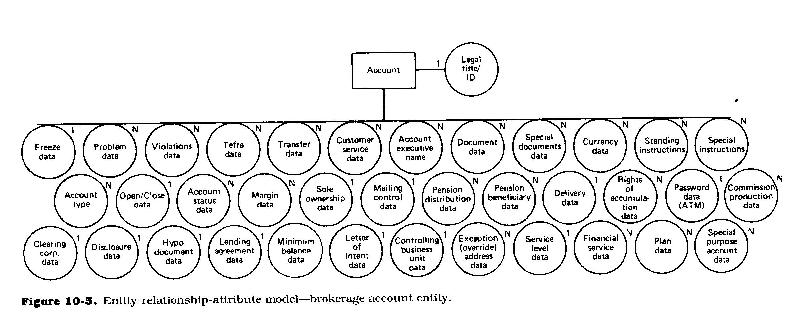
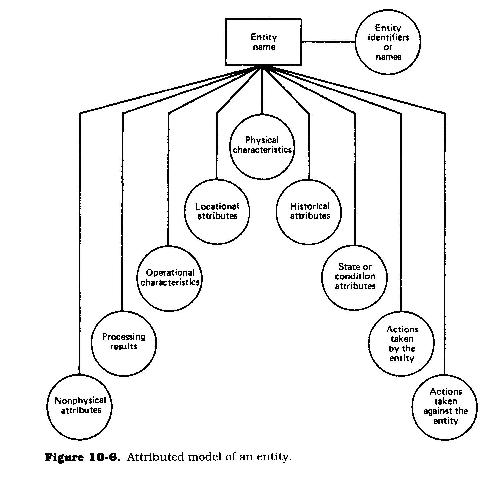
Entity attributes represent:
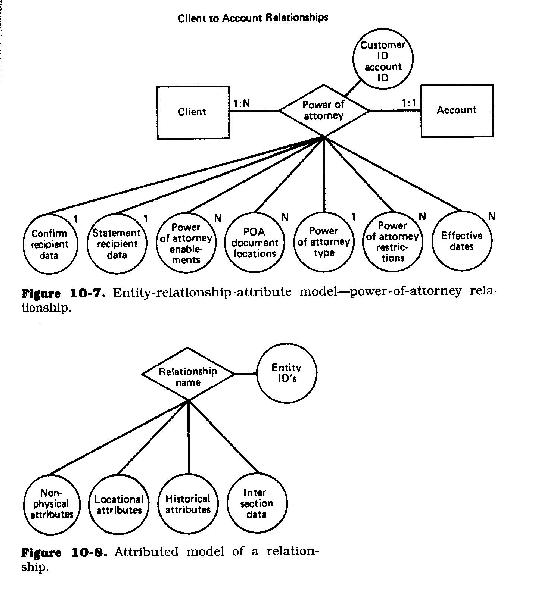
At step 2, each distinct relationship between each pair of related entities should be extracted from the master diagram and placed on a separate page.
The attributes of each relationship are those categories of data which are necessary to qualify the relationship and describe when and under what conditions it occurs, and any other information which relates only to the connection between the entities and not to either entity independently.
As each attribute is identified and named, it should be drawn below the relationship symbol and connected to the relationship by a single line. As with the attributes of entities, theattribute should be annotated with a discrete number or with n, to identify the number of occurrences of this particular attribute which are necessary to fully describe or qualify the relationship (Figure 10.7).
The relationship attributes should include all attributes necessary to clearly and completely identify the many qualifications of that particular relationship between the two entities and the conditions under which the relationship exists. Relationship attributes (Figure 10.8) represent some descriptor or qualifier of the relationship such as:
At each ofthe first three levels, these diagrams consist only of shapes with names. In data processing terms, and in a very general sense, they could be considered to be the identification of the record types (or record groupings) which will ultimately contain the data elements. It must be noted that the attributes represent mutually exclusive and mutually independent categories ofdata. They may or may not represent actual record types.
In thelogical data structure models created at a later date from these ER models,attributes may be combined to form records or more general records, or they maybe kept separately. The entity shapes are the names of the logical data aggregates (or structures) of theenvironment.
TheEntity-Relationship-Attribute-Data Level
A fourth, or data element, level may be added when the models are developed in conjunction with the data processing systems development projects. This is the level which is most familiar to data processing specialists and consists of identifying and defining the specific data elements needed to describe each attribute of each entity and each relationship. Data elements are assigned only to attributes. In a sense, data elements are the attributes of the attributes. Since we know what the entity and what the attribute represent,the addition of elements should be relatively straight forward.
Construction of anEntity-Relationship Diagram
Regardless of the level being addressed, the following rules apply to the construction of an entity-relationship diagram.
a = the entity onthe left side of the diamond
and
b = the entity on the right side of the diamond
and a and b may have any numeric value equal to orgreater than 1, or N (denoting an indefinite number more than 1).If all attributes and all relationships connected to the entity rectangle do not have the potential to apply equally to each and every entity occurrence defined to it, then the definition of the entity being used must be changed and a new entity, new entity set, new entity subset, or new entity subsets, must be created until this condition is satisfied.
The abovediscussion assumed that one and only one model will be created at each level for the firm. However since most projects are undertaken for specific user areas, it may be desirable to create different models for each user area.
Just as an entity can be viewed from many different perspectives, and may seem to be different from each perspective, so too entity-relationship and entity-relationship-attribute models can be different from the various perspectives of the firm. Each area of the firm defines the entities of the firm in different ways and relates to them in different ways.
All entity-relationship models need not contain every entity of the firm. They need only contain the entities ofinterest to the particular area being modeled. That is,
These types of models arebusiness models, rather than data processing models. That is they reflect business environments not methods of processing. The types of entities andrelationships selected to be included in each model, the definitions of those entities, and the attributes used to describe those entities and relationships all combine to define the environment being modeled and the nature of the model itself.
Documentation of theModel
As the analyst completes the individual diagrams, he or she should be preparing dictionary entries for each attribute of each entity and each entity-to-entity relationship identified and defined. A description of each relationship should be prepared and entered into the dictionary as well. The first time an entity is extracted from the master diagram, a description of that entity should be prepared for the dictionary. Although any given entity may appear on multiple diagrams, only a single entity description need be entered into the dictionary. Thereafter the entity description will need to be updated with any additional relationships which it participates in, or for any additional attributes associated with it.
Each attribute should be identified, at minimum, with its name and the list of data elements of which it is composed. Each entity should be described, at minimum, with its name, a list of all subset entities contained within it, all aliases by which the entity is known, the names of all the relationships which it participates in, and the list of all attributes which are used to describe it. Each relationship should be described, at minimum, by its name, the entities involved in the relationship, and the names of the attributes associated with it.
Data Flow Diagrams
The data flow diagramming technique is usually associated with Yourdon and DeMarco, its developers and primary proponents. Data flow diagrams depict data flows and data transformation processes. A data transformation process is one which transforms input data into some form of output data. The orientation of dataflow diagrams is toward business processes, the data which feed them, and the data which they generate. In addition, data flow diagrams are also oriented toward the system level and result in system-processing specifications.
A data flow diagram utilizes three symbols: a circle, which represents a process; a curvedline with an arrowhead, which represents the flow of data to or from the process along with the name of the data input or data output; and two short parallel lines representing a data store (Figure 10.9). In some instances a data flow diagram may also contain rectangles which represent terminators. A terminator is a data source or data end user.
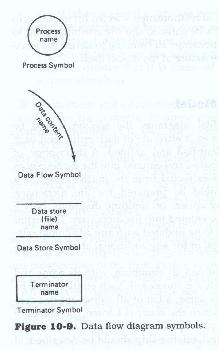
Data input to a process may originate with a terminator, another process, or a datastore. A data store is synonymous witha file and holds data between processes. In a data flow diagram, all processes and data stores must have at leastone input and one output.
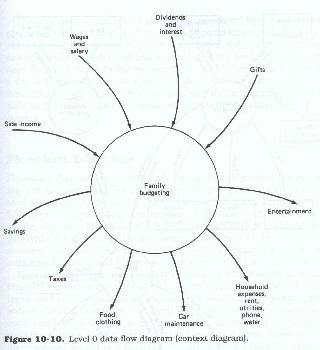
As with entity-relationship diagrams, data flow diagrams are constructed in stages, or levels. The first, or level zerodiagram (Figure 10.10), is called the context diagram and contains a single bubble which represents the entire system. To that bubble are connected data flow lines representing all major inputs and outputs.
Once thecontext diagram is completed, a level one diagram should be drawn. A level one data flow diagram is called an essential model and depicts the major processes within the system. To construct it (see Figure 10.11), one first starts with a bubble which represents a major process. To that bubble are connected any input and output data flow lines associated with it. Each line is identified with the name of the particular data type. The process is identified with the name of the process which it depicts. Each input data flow line must originate with a process, a terminator, or a datastore and terminate at the process bubble. All output data flow lines must originate with the process and terminate at a terminator, a data store, or another process.
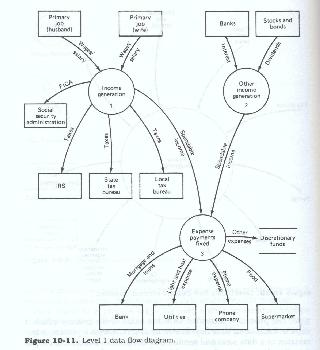
As a secondstep the analyst should take each identified input and output from that processand add either the data stores, terminators, or other process bubbles from which the data originate or to which they are sent.
The above process is repeated until all identifiable and significant data flows, data stores, terminators, and processes have been added to the diagram. The final step is to number each process bubble.
Once the above process is completed, the analyst may proceed to the next level diagram. Each process in the higher level diagram is decomposed into its more detailed component processes. For each of these more detailed component processes, each of its data flows, data stores, and terminators should be represented. These data flows, datastores, or terminators may be carried down from the preceding level, or they may completely originate and terminate within the major process itself. This diagram is completed when each of the major processes from the preceding level has been decomposed and diagrammed.
The process of describing the data flow of each level is continued until the analyst arrives at a set of diagrams where each process represents a single task or data transformation with its associated input and output data flows and their associated data stores and terminators.
The processes at each level should be associated back to the parent process at the preceding level by means of somescheme of numbers, or numbers and letters. All processes, data flows, data stores, and terminators should be described and entered into the analyst's data dictionary. Each data flow should be described, at minimum, with a name and a list of the data elements which compose it. Each process should be described, at minimum, with its name, and the tests made against the data, or the formulas which represent the transformations from input to output.
Flowchart Diagrams
Flowchart diagrams are useful tools when one wishes to represent either the processing and decision logic flows within a particular process, with its associated inputs and outputs, or the flow of an entire system, with all the various types of processing, preparation, inputs, outputs, data storage media, and other hardware which are associated with it. Although used primarily for depicting the implementation flows of data processing systems, it can be useful in an environment where one has a mix of both automated and manual processes, data stores, forms, and hardware.
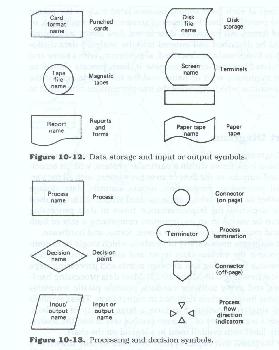
Flowchart diagrams use a variety of symbols which singly or in combination represent the various data input and output sources, media types, and various processing and decision points and processing steps within a logical flow (Figures 10.12 and 10.13). Most data processing hardwarevendors, and many software vendors provide plastic templates with the various basic symbols depicted in cutout form. These symbols may be used singly or combined with each other to form a large variety of symbols. Since there are a wide variety of different symbol sets in use, the analyst should clearly label each symbol used in a legend on the chart.
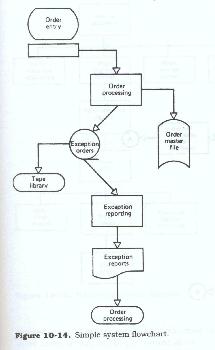
Flowchart diagrams that depict system flows are usually drawn in a linear fashion beginning at the top of the diagram, with either a manual operation, a form, amanual input or terminal input device, or a terminator which represents an enduser. In some cases, flowcharts maybegin with a tape or disk symbol. These symbols represent input sources and are connected to other symbols which represent either manual operations or automated processing points.
Each ofthese processing symbols is connected to some output media symbol, either atape, disk, form, or display station. Each of these outputs is then connected either to another processing symbol as an input (with other first use inputs) or to inputs carried over from prior processing, or to a terminator, representing short- or long-term storage or an end user. This type of flowchart is complete when all processing boxes have been drawn and all outputs have beensent to storage or to a terminator (Figure 10.14).
Flowchartdiagrams which depict processing and decision logic usually contain a more restricted set of symbols, usually process, input, output, decision, and terminator symbols. Figure 10.15 showsa simple logic flow diagram. In some cases they may also contain data arranging symbols (sorting, collating, etc.). These flowcharts are also drawn in a linear fashion, starting with some input at the top. Since they depict only the tasks and individual steps within a process, they do not represent external data storage or entities. Input and output symbols are drawn only to depict at what internal step the data either enter or are generated.
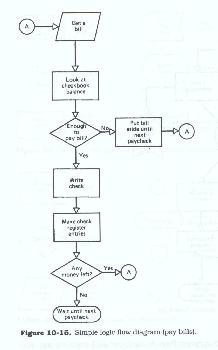
Normally, these intra-process flowcharts depict each separate step and decision point in the data transformation or usage process. Decision points are usually depicted as a diamond shape with each valid condition or test result indicated as a branch from the symbol. Each branch leads to a separate processingleg or sequence of steps. These processing legs or the sequence of steps may remain separate for the remainder of the process, may join the main stream later in the processing flow, or may terminate after some error-handling procedure. In some cases, they may loop back to some earlier point in theprocessing flow after corrective action has been taken or to remake thedecision after additional processing has occurred.
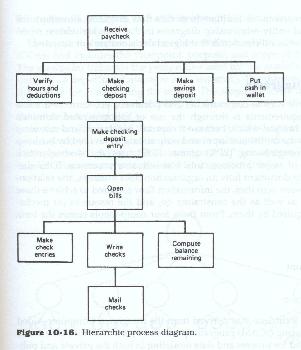
Hierarchic ProcessDiagrams (Figure 10.16)
A process can be considered to be a series of activities,each activity consisting of a series of tasks. Although this view is easy to visualize, it is only partially accurate. In many environments, thetasks which constitute a process are not all performed every time. The particular tasks performed and the sequence in which they are performed is dependent upon the stimulus which activates the process. In some cases atask may be performed once, in others it may be performed multiple times, and in still other cases, it may not be performed at all.
Each task can be thought of as being dependent upon some preceding sequence of tasks. Viewed in this manner, the task sequence can be seen as a hierarchy with multiple levels and multiple legs. Rectangles are used to represent the tasks. In all cases there is a primary or roottask, i.e., one which begins the process, or which must precede allothers. Once this task, which isusually the one that receives the input document, is performed, it is usually followed by one or more second-level tasks which may be sequential or random, and mandatory, optional, or mutually exclusive. Each of these tasks in turn may trigger, or require the performance of, still other tasks which may also be sequential or random, and mandatory, optional, or mutually exclusive. This diagrammatic method is similar to a flowchart in that the flow ofprocesses or tasks can be easily represented. It differs from data flow diagrams, flowchart diagrams, andentity-relationship diagrams in that data are usually not represented. Another difference is that logicaldecisions are not depicted.
IDEF Diagrams
An effective way to communicate and document processes and information requirements is through the use the Integrated DEFinition (IDEF)technique. Because it captures constraints and resources as well as the traditional input and output data, itis favored by Business Process Reengineering teams. IDEF uses the decomposition approach to of major processes into less inclusive processes. IDEF diagrams help document how an organization does business, the relationships between activities, the information flow required to achieve those activities, as wellas the constraints on, and the resources (or mechanisms) required by them. From these four components comes the term ICOM for:
The IDEF technique was derived from the Integrated Computer Aided Manufacturing (ICAM) program sponsored by the U.S. Air Force and is widely used for process and data modeling in both the private and public sectors. Several CASE tools support the IDEF approach, although few ifany support IDEF and any of the other modeling techniques referred to in this chapter. This tool supports activity (process) modeling (IDEF0) and Data Modeling (IDEFlX). IDEF0 is used to graphically depict business process activities. IDEFlX is used to explore and document data elements and their relationships in an enterprise.
An IDEF0 model consists of three major components:
Examples of a node tree and activity box are shown in Figure 10.17 Node Tree and Figure 10.18 IDEF0 Activity Box with ICOMs.
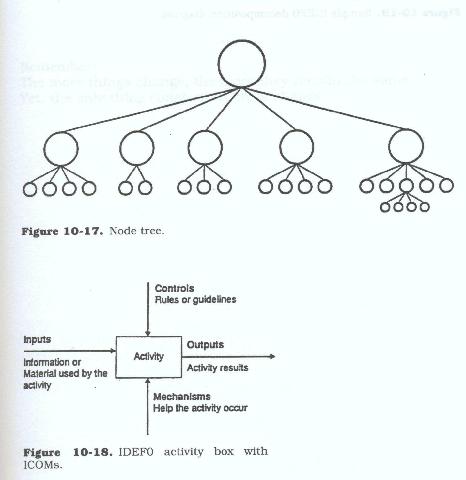
The context diagram contains the activity box with its associated ICOMs and includes the viewpoint, purpose, and scope of the project The viewpoint indicates the perspective used for the model’s construction, (e.g. a department manager or a customer.) The purpose indicates the reason for constructing the model. The scope indicates the boundaries of the model (e.g., Which part(s) of the organization will constitute the context of the model.)
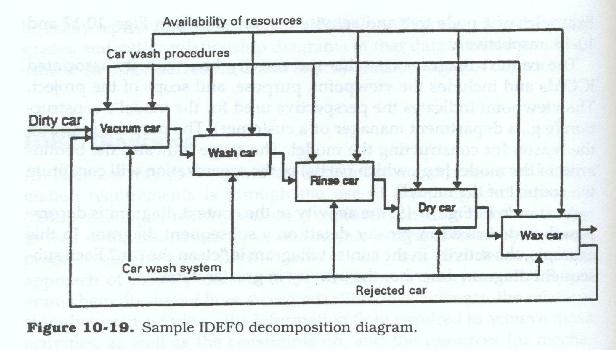
As shown in Figure 10.19, IDEF0 Decomposition-Diagram, theactivity in the context diagram is decomposed or described in greater detail ona subsequent diagram. In this example, the activity in the context diagram is "Clean the Car". Each subsequent diagram describes the activity in greater detail.
A Professional's Guide to Systems Analysis, Second Edition
Written by Martin E. Modell
Copyright © 2007 Martin E. Modell
All rights reserved. Printed in the United States of America. Except as permitted under United States Copyright Act of 1976, no part of this publication may be reproduced or distributed in any form or by any means, or stored in a data base or retrieval system, without the prior written permission of the author.