Project Planning
CHAPTER SYNOPSIS
Once the project initiation phase is completed, the project team, usually the project manager and the analysts in the early stages, must determine the scope of the effort necessary to accomplish the necessary tasks. There are many methods available for accomplishing this; many of them use graphics of varying types, but all require the same basic information.
This chapter discusses the information which must be assembled to construct a project plan and the steps necessary to construct a graphic version of a plan in either PERT, PERT/CPM, or Gantt form. The chapter also includes a discussion of Work Breakdown Structures (WBS) and Function Point Analysis.
Project Planning
Once the project initiation phase is completed, the project team, usually the project manager and the analysts in the early stages, must determine the scope of the effort necessary to accomplish the necessary tasks. There are many methods available for accomplishing this planning process; many of them use graphics of varying types, but all require the same basic information.
Work Breakdown Structures (WBS)
The development of a project plan is predicated on having a clear, and detailed understanding of both the tasks involved, the estimated length of time each task will take, the dependencies between those tasks, and the sequence in which those tasks have to be performed. Additionally, resource availability must be determined in order to assign each task or group of tasks to the appropriate worker.
One of the methods used to develop the list of tasks is to create what is known as a Work Breakdown Structure (WBS).
A definition
A Work Breakdown Structure (WBS) is a hierarchic decomposition or breakdown of a project or major activity into successively levels, where each level is a finer breakdown of the preceding one. In final form a WBS is very similar in structure and layout to a document outline. Each item at a specific level of a WBS is numbered consecutively (e.g. 10, 20, 30, 40, 50). Each item at the next level is numbered within the number of its parent item (e.g. 10.1, 10.2, 10,3, 10.4)
The WBS may be drawn in diagrammatic form (if automated tools are available) or in a chart form resembling an outline.
The WBS begins with a single overall task representing the totality of work to be performed on the project. This becomes the name of the project plan WBS
Using a methodology or system life cycle steps as a guide, the project is divided into its major steps. In our case we will use the life cycle described in chapter three as our example. The first phase is Project Initiation, the second major phase is Analysis followed by Design, Construction, Testing, Implementation, and Post-Implementation Follow-up. Each of these phases must be broken down into their next level of detail, and each of those, into still finer level of detail, until a manageable task size is arrived at. The first level of Work Breakdown Structure for the life cycle is illustrated in Table 6.1
Tasks at each successively finer level of detail are numbered to reflect the task from which they were derived. Thus the first level of tasks would be numbered 1.0, 2.0, 3.0, and so forth. Each of their sub-tasks would have a two part number. The first part reflecting the parent task and the second part being the sub-task number itself e.g. 1.1, 1.2, 1.3, etc. As each of these is in turn decomposed or broken down into their component tasks, the components receive a number comprised of its parent’s number plus a unique number of its own.
A Definition:
A manageable task is one where the expected results can be easily identified, success, failure, or completion of the task can easily be ascertained, the time to complete the task can easily be estimated, and the resource requirements of the task can easily be determined.
|
WBS Number |
Task Description |
|
1.0 |
Project Initiation |
|
1.1 |
Draft Project Plan |
|
2.0 |
Analysis Phase |
|
2.1 |
Plan User Interviews |
|
2.2 |
Schedule User Interviews |
|
3.0 |
Examination and Test |
|
4.0 |
Design |
|
5.0 |
Test |
|
6.0 |
Implementation |
|
7.0 |
Post-Implementation Review |
Table 6.1 First level of Work Breakdown Structure for the life cycle
Planning Methods
There are various methods for generating the project plan. Some of the most widely used are discussed below.
PERT-project evaluation and review technique
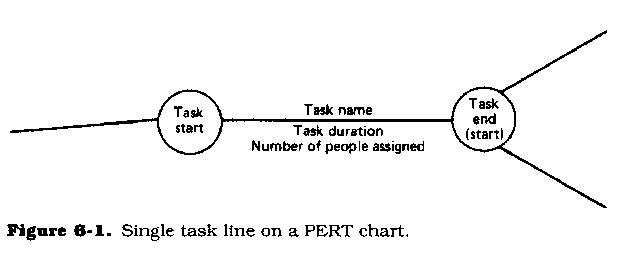
PERT charts depict task, duration, and dependency information. Each chart starts with an initiation node from which the first task, or tasks, originates (Figure 6.1). If multiple tasks can begin at the same time, they are all started from the node and branch, or fork out from the start point.
Each task is represented by a line which states its name or other identifier, its duration, the number of people assigned to it, and in some cases the initials of the personnel assigned. The other end of the task line is terminated by another node which identifies the start of another task, or the beginning of any slack time. Slack time is waiting time between tasks.
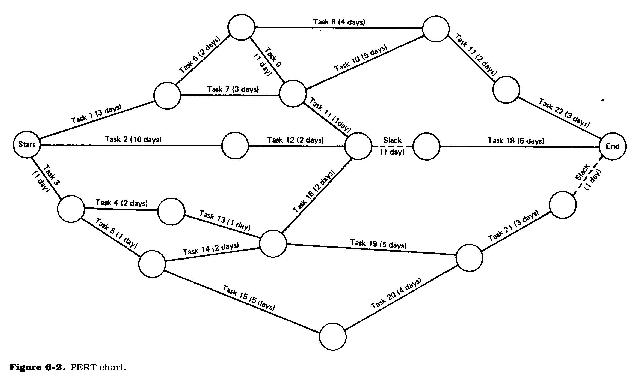
Each task is connected to its successor tasks in this manner forming a network of nodes and connecting lines. The chart is complete when all final tasks come together at the completion node. Where slack time exists between the end of one task and the start of another, the usual method is to draw a broken, or dotted line between the end of the first task and the start of the next dependent task.
A PERT chart (Figure 6.2) may have multiple parallel or interconnecting networks of tasks. Where the project has scheduled milestones, checkpoints, or review points (all of which are highly recommended in any project schedule), the PERT chart will note that all tasks up to that point terminate at the review node.
It should be noted at this point that project review, approvals, user reviews, etc., all take time. This time should never be underestimated when drawing up the project plan. It is not unusual for a review to take a week or even two. Obtaining management and user approvals may take even longer.
When drawing up the plan, be sure to include tasks for documentation writing, documentation editing, project report writing and editing, and report reproduction. These tasks are usually time consuming so don't underestimate how long it will take to complete them.
PERT charts are usually drawn on ruled paper with the horizontal axis indicating time period divisions in days, weeks, months, etc. Although it is possible to draw a PERT chart for an entire project, the usual practice is to break the plans into smaller, more meaningful parts. This is very helpful if the chart has to be redrawn for any reason, such as skipped or incorrectly estimated tasks.
Many PERT charts terminate at the major review points, such as at the end of the analysis stage or even at the end of the feasibility analysis. Many organizations include funding reviews in the project life cycle. Where this is the case, each chart terminates in a funding review node.
Funding reviews can affect a project in that they may either increase funding, in which case more people may be made available, or they may decrease funding, in which case fewer people may be available. Obviously more or less people will affect the length of time it takes to complete a project.
CPM-critical path method
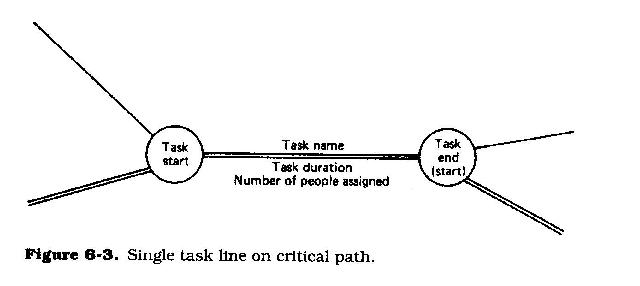
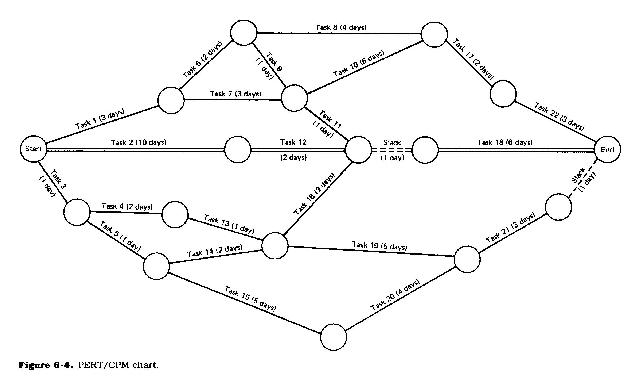
CPM charts are similar to PERT charts and are sometimes known as PERT/CPM. In a CPM chart the critical path is indicated (Figures 6.3 and 6.4). A critical path consists of that set of dependent tasks (each dependent upon the preceding one) which together take the longest time to complete. Although it is not normally done, a CPM chart can define multiple, equally critical paths. Tasks which fall on the critical path should be noted in some way, so that they may be given special attention. One way is to draw critical path tasks with a double line, instead of a single line.
Tasks which fall on the critical path should receive special attention, both by the project manager and by the personnel assigned to them. It is possible that the critical path for any given project may shift as the project progresses. This can happen when tasks either fall behind or tasks are completed ahead of schedule, causing other tasks which may still be on schedule to fall on the new critical path.
Gantt chart
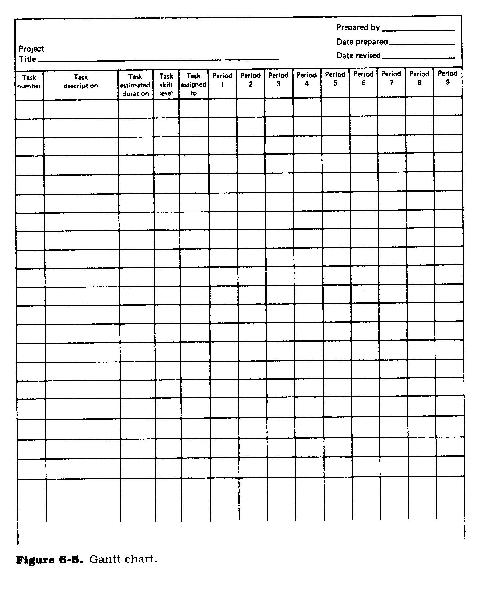
A Gantt chart (Figure 6.5) is a matrix which lists on the vertical axis all tasks to be performed. Each row contains a single task identification which usually consists of a task number and name. The horizontal axis is headed by columns indicating estimated task duration, skill level needed to perform the task, person assigned to the task, followed by one column for each period in the project's duration. Each period may be expressed in hours, days, weeks, months, etc. In some cases it may be necessary to label the period columns as period 1, period 2, and so on.
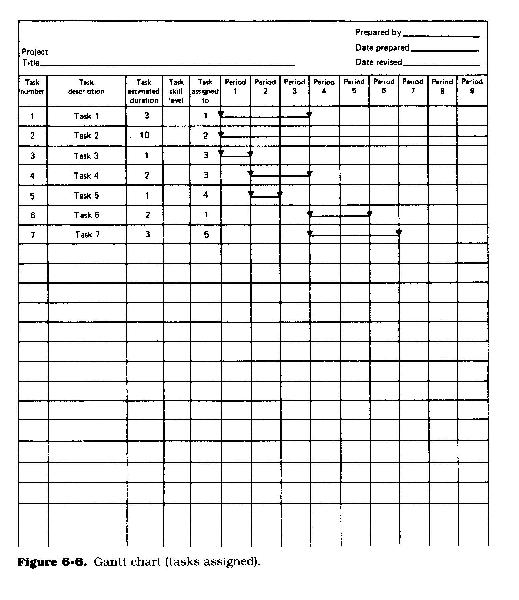
The graphics portion of the Gantt chart consists of a horizontal bar for each task connecting the period start and period ending columns. A set of markers is usually used to indicate estimated start and end and actual start and end. Each bar is on a separate line, and each person assigned to the task is on a separate line (Figure 6.6). In many cases when this type of project plan is used, a blank row is left between tasks. When the project is underway, this row is used to indicate progress, indicated by a second bar which starts in the period column when the task is actually started and continues until the task is actually completed. Comparison between estimated start and end and actual start and end should indicate project status on a task-by-task basis.
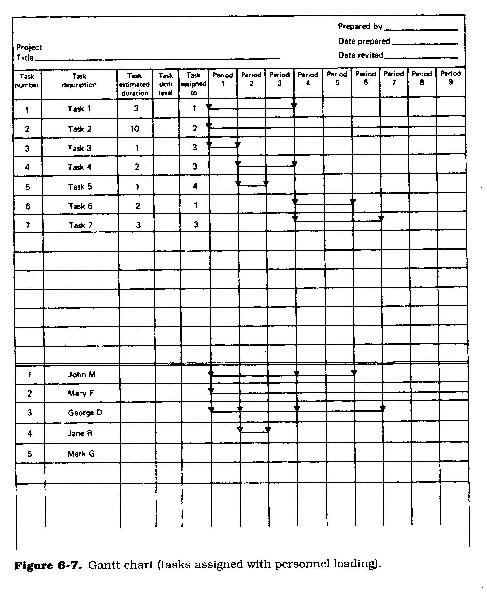
Variants of this method include a lower chart which shows personnel allocations on a person-by-person basis. For this section the vertical axis contains the name of the people assigned to the project, and the columns indicating task duration are left blank as is the column indicating person assigned. The graphics consist of the same bar notation as in the upper chart, except here the period column contains a bar only when the upper chart indicates that the person is working on a task (Figure 6.7). The value of this lower chart is evident when it shows slack time for the project personnel, that is, when they are not working on any project.
Function Point Analysis
The usefulness of a project plan is dependent on the manager or project leader’s ability to estimate project task duration and to measure progress. The measurement of progress is dependent upon the selection of the proper metrics A metric is simply a standard of measure. Every task in a project plan should be a manageable task.
However for purposes of project planning management must be aware of the time it will take to complete the project. Many methods have been used to provide an answer to the inevitable question “How long it will take?”
The most objective method available today is know as function point analysis. Developed by IBM in the mid eighties [1] , function points are based on a concept of units of work. In other words how many units of work should it take to complete a certain type of task. In building software, there are certain basic types of tasks which consume units of work. These basic tasks include building tables, input screens, and output reports. If building one screen takes seven units of work, then building seven screens should take forty-nine units of work, etc.
The total number of function points for a project can be calculated, these can be adjusted for project complexity, and multiplied by the average number of person-days it takes to complete a function point. The resultant number is the number of person-days it will take to complete the project While no estimation process is total accurate, function point calculations do arrive at a reasonable approximation of project duration If the total project duration is allocated across the project life cycle phase duration can be ascertained as well.
Figure 6.8 provides a composite function point calculation form.
Major Factors Raw Empirical Unadjusted
Count Weight Total
1. Number of Inputs ________ x 4 ________
2. Number of Outputs ________ x 5 ________
3. Number of Inquiries ________ x 4 ________
4. Number of Data Files ________ x 10 ________
5. Number of Interfaces ________ x 7 ________
A) Unadjusted Total ________
(Sum of 1 through 5)
B) Complexity Adjustment Factor ________
(Using Method one or Method two)
C) Adjusted Function Point Total ________
(Multiply (A) Unadjusted Total by (B) Complexity Adjustment Factor)
D) Estimated Project Development Person-Hours ________
(Multiply (C) Adjusted Function Point Total by 35)[2]
Adjustments to Project Development Person Hours
1. Project Management and Support ________
Add 5% of D above
2. Testing and Defect removal ________
Add 25% of D above
3. Paperwork (Development Documentation and Plans) ________
Add 20% of D above
4. Configuration Management and Quality Assurance ________
Add 10% of D above
5. Data Administration ________
Add 25% of D above
6. Customer Service Staff and User Training ________
Add 15% of D above
E) Total Adjustments to Project Development Person Hours ________
(Sum of 1 through 6 above)
F) Estimated Project Duration in Person Days ________
(Divide Estimated Project Person-Hours (D) by 7.5)[3]
Adjustments to Project Duration in Person Days
G) Management and User Reviews ________
Add 15% of F above
H) Total Project Duration in Person Days ________
(Sum of (G) and (H) above)
Major Factors
Inputs are screens or forms through which human users of an application add new data or update existing data. If an input screen is tool large for a single normal display (usually 80 columns by 25 lines) and flows over onto a second screen, the set counts as 1 input. Inputs that require unique processing are what should be considered.
Outputs are screens or reports which the application produces for human use or for other programs. Note that outputs requiring separate processing are the units to count:
Inquiries are screens which allow users to interrogate an application and ask for assistance or information such as help screens
Data files are logical collections of records which the application modifies or updates. A file can be a flat file such as a tape file, one leg of a hierarchical database such as IMS, one table within a relational database, or one path through a CODASYL network database.
Interfaces are files shared with other applications, such as incoming or outgoing tape files, shared databases, and parameter lists
(B) Complexity Adjustment Factors Worksheet - Method One
Problem Complexity ________
1. Simple algorithms and simple calculations
2. Majority of simple algorithms and calculations
3. Algorithms and calculations of average complexity
4. Some difficult or complex calculations
5. Many difficult algorithms and complex calculations
Code Complexity _________
1. Non-procedural (generated, spreadsheet, query, etc.,)
2. Well structured with reusable modules
3. Well structures (small modules and simple paths)
4. Fair Structure but some complex modules and paths
5. Poor structure with large modules and complex paths
Data Complexity _________
1. Simple data with few variables and low complexity
2. Numerous variables but simple data relationships
3. Multiple files, fields, and data interactions
4. Complex file structures and data interactions
5. Very complex file structures and data interactions
Total Complexity Factors _________
Complexity Adjustment Factor Conversion Table
Total Complexity Adjustment
Factors Multiplier
3 0.70
4 0.75
5 0.80
6 0.85
7 0.90
8 0.95
9 1.00
10 1.05
11 1.10
12 1.15
13 1.20
14 1.25
15 1.30
(B) Complexity Adjustment Factors Worksheet- Method Two
a. Data Communications ________
b. Distributed Functions ________
c. Performance Objectives ________
d. Heavily Used configuration ________
e. Transaction Rate ________
f. On-line data entry ________
g. End-user efficiency ________
h. On-line Update ________
i. Complex Processing ________
j. Reusability ________
k. Installation Ease ________
l. Operation Ease ________
m. Multiple Sites ________
n. Facilitate Change ________
A) Total Complexity Adjustment Factors ________
B) Multiply Total Complexity Adjustment Factors by 0.01 ________
C) Add Constant (0.65) to achieve a
decimal factor ________
Complexity Adjustment Factors
a. Data Communications
Data Communications implies that data and/or control information would be sent or received over communications facilities
0 Batch Applications
1 Remote printing or data entry
2 Remote printing and data entry
3 A Teleprocessing front end to the application
4 Applications with significant teleprocessing
5 Applications that are dominantly teleprocessing
b. Distributed Functions
Distributed functions are concerned with whether the application is monolithic and operates on a single contiguous processor or is distributed among a variety of processors.
0 Pure Monolithic applications
1 Applications that prepare data for other components
2 Applications distributed over a few components
3 Applications distributed over more components
4 Applications distributed over many components
5 Applications dynamically performed on many components
c. Performance Objectives
0 No special performance criteria are stated by the users of the application
5 Users insist on very stringent performance targets that require considerable effort to achieve
d. Heavily used configuration
0 Application has no special usage constraints
5 Anticipated usage requires special effort to achieve
e. Transaction rates
0 Volume of transactions is not significant
5 Volume of transactions is high enough to stress the application and require special effort to achieve desired throughputs
f. On-line data entry
0 None or fewer than 15 percent of the transactions are interactive
5 All or more than 50 percent of the transactions are interactive
g. End-user efficiency
0 There are no end-users or there are no special requirements for end users
5 The stated requirements for end-user efficiency are stringent enough to require special effort to achieve
h. On-line updates
0 None
5 On-line updates are both mandatory and especially difficult (e.g. because of the need to back up or protect data against accidental change)
i. Complex processing
0 None
5 Requires extensive logical decisions, complicated mathematics, tricky exception processing or elaborate security schemes
j. Reusability
0 Functionality is planned to stay local to the current application
5 Functionality and other project deliverables are intended for widespread utilization by other applications
k. Installation ease
0 Installation is insignificant
5 Installation is both important and so stringent that it requires special effort to accomplish
l. Operational ease
0 Operational ease is Insignificant
5 Ease of use is so important that it requires special effort to achieve
m. Multiple sites
0 Only one planned using location
5 Project and its deliverables are intended for may diverse locations
n. Facilitate Change
0 Change does not occur
5 Application is developed specifically to allow end-users to make rapid changes to control data or tables which they maintain with the aid of the application
[1]For more information on the history and use of Function Points see, Jones, Capers, “Applied Software Measurement: Assuring Productivity and Quality,” McGraw-Hill, New York 1991
[2]Hours per function point based upon U.S. average software productivity rates of five functions points per person-month across system software, MIS software, and military software
[3] Hours per day based on an eight-hour work day and allowing one-half hour lost for coffee and personal need breaks
A Professional's Guide to Systems Analysis, Second Edition
Written by Martin E. Modell
Copyright © 2007 Martin E. Modell
All rights reserved. Printed in the United States of America. Except as permitted under United States Copyright Act of 1976, no part of this publication may be reproduced or distributed in any form or by any means, or stored in a data base or retrieval system, without the prior written permission of the author.