Semantic Analysis and Data Analysis
Semantics is the study of meaning in language. It is also, and perhaps as important, the study of the relationships between signs and symbols and what they represent.
A model is a narrative and or graphic representation of a physical or conceptual environment. A model must identify the major components of the environment, describe those components in terms of their major attributes, and depict the relationships between the components and the conditions under which the components exist and interact with each other. A model may also represent an idea, or be a graphic expression of some concept or other expression.
A model is constructed from signs and symbols. In order for the model to accurately portray the ideas of the model developers, that developer must have a clear, and precise understanding of what those ideas are. This is especially true when the model is attempting to depict a conceptual environment.
Communication is the exchange of ideas, or at minimum the presentation of ideas. At minimum, because while ideas may be presented, words may be transmitted, they must be received and understood for communication to occur. Word are the mechanism for the transmission of ideas.
The importance of precise communication
We use both words and symbols to communicate ideas. The most common form of symbols are mathematical. If we wish to extend the point even further we can look at words themselves and even the letters used to form the words as symbols. The effectiveness of the communication is due in a large part to its precision. That is how precisely the symbols express the idea and how precisely both parties understand that expression.
Even a mathematical formula composed of basic symbols, numbers and operators (plus, minus, equal, etc.) can express a very precise idea only if the meaning of each symbol is understood. More complex mathematical ideas employ still more symbols, and the most complex mathematics employ symbols known only to those who have had advanced training. In some cases, ideas are so complex that new symbols are invented to express them.
In mathematics however, each symbol has one and only one meaning or use. If that were not so, the foundations of mathematics and of mathematically based sciences would flounder and generally be rendered ineffective.
Mathematics can be used imprecisely, in that numbers can be chosen which represent only partial truths, or in other cases numbers can be chosen and used in ways that they were not meant to be used. The science of statistics uses numbers to prove various hypotheses, and we have seen over and over again that by selecting the right numbers anything can be proven. There is a cliche which is used frequently when referring to statistics which states that "figures don't lie but liars figure."
This is not to imply that statistics are inherently inaccurate, nor that we cannot use statistics effectively. It does however imply that the explanations of statistical evidence, and the manner in which those numbers are generated and extrapolated is open to interpretation. If we count the males and females in a room we can get precise figures. If we use those numbers for any other purpose, we are extrapolating and the conclusions are less precise than if we look at the original numbers.
The difference in meaning is derived from the fact that we have placed interpretation on the numbers. We have changed their meaning.
Communication using words versus numbers
Words, unlike numbers and mathematical symbols have no precise meaning. Most words in fact have multiple meanings and the correct (or sometimes approximate) meaning is derived only because the words are placed in context, or in juxtaposition with other words. Frequently words are made up to represent an idea (a frequent occurrence in scientific and high-tech circles) and in others words are borrowed from other contexts and given new meanings.
Many words are used as if they have a precise meaning. For instance. In the previous paragraph I used the word "frequently." Frequently means often. Now we have one imprecise word defined by another imprecise word, which according to the dictionary I am using is defined as frequent. In other words we have a circular definition, one word used to define another which defines the first. How many is frequently? And yet the word is used in documentation to describe how many times something happens. How often have we used the word high-tech? We all know what it means, but how precisely can we define it. Exactly what does high-tech mean? For that matter, what does technology mean and how can it be considered either high or low?
Words are symbols. Symbols which represent both things and ideas, and which in turn are used to describe other things and ideas.
Words have multiple meanings and are used to as a communication vehicle, relying on context and other words to make communication clear.
Models may be more or less precise than words. When we use pictures in our models it is usually clear as to what the picture represents, a house, a tree, a car, etc. When we use shapes with labels it becomes less clear, and the fewer the words we use in the label, the less clear the meaning.
Models are a representation of reality. Graphs and charts (bar charts, pie charts, etc.) represent mathematical ideas. However they only are meaningful to the extent that the numbers are present, the context are clearly identified and the components are clearly labeled. Imagine if you will the effectiveness of a pie chart with no numbers associated with the slices. The chart conveys a vague, but imprecise message, much less precise than if the percentages or raw numbers were presented as well. Without numbers could we not tell exactly how big a slice we were looking at, however we could draw some conclusions from its relative size.
A bar chart or line chart without the axes clearly labeled again gives a general impression, but no precision. How much of a difference is there between a line graph where the horizontal scale is clearly marked as starting at zero and one with no scale notation at all.
Data Processing models
Data processing professionals use many different types of models, with many different types of symbols. These models represent a wide variety of concepts which themselves are not clearly defined. An in many cases these models are not accompanied by any explanation as to the meaning of those symbols, nor even definitions of the concepts themselves.
A frequently used model is the functional decomposition model. This usually begins with a single function which is decomposed into more elemental functions. The iterative decomposition is complete when the functions have been decomposed to the point where processes have been identified. These processes are in turn decomposed to the point where activities or tasks have been identified.
The models look impressive, and yet they are extremely imprecise. To begin with, rarely is the term or concept of a function defined, much less the individual functions themselves. If decomposition is the process of separating into component parts, then a given function must be described in such a manner that we know what the component parts are. How else can we decompose a function into sub-functions? In addition we must have a function must have identifiable components that are in fact separable.
A picture is worth a thousand words. Pictures and models clarify words by providing an alternate means of expression. The use of both words and pictures or diagrams in documentation is for precisely that reason. They provide the reader, in our case the user, with alternative ways of looking at a problem, or a solution. In some cases however it is difficult to communicate an idea with words alone, and the pictures or diagrams take the place of, or augment the words.
Words and data
Much has been written about data dictionaries and their capacity to store definitions about all of the components and elements of a data processing system. Dictionary entries are described by a combination of fixed items (size, format, program use, file name, value ranges, etc.) and narrative definitions. These entries are intended to serve two purposes. First, they provide the developer, the programmer, with the specifications of the data. These specifications describe what the data must look like, and how it must be described to the computer programs which must operate on it. Second, they provide a definition for the users of that data which explains what that particular element or component means or what it represents, how it was derived, how it is to be used and why it is important. The definition may provide other information but these are the most critical to the user.
But it must be remembered that we are not describing the content of data items but the container of that data.
Data are nothing more than words and number to which we have attributed meaning. Data derives its meaning not from what it is but from how it is used. Data is one or more words or numbers, that have a label (data items always have a name) and a meaning assigned to them. Without a label an element of data cannot be referenced, and without a definition or meaning assigned to it, we do not know what it represents. Some data has meaning which appears obvious. A person's last name, is more or less obvious. However, that word which represents the last name can be a person's last name, the name of a store, the name of a street, the name of a city or town, or anything. For instance the word "Pontiac" is the name of a make of automobile and an Indian chief, it is also the name of towns in the both the state of Michigan and the state of Illinois. What the word means at any given time, is obviously dependent on context and usage.
With numbers, the assignment of meaning is even more critical. A given number can represent just about anything. The number 98.6 could be the normal temperature of the human body, the frequency of my favorite radio station, part of a set of map coordinates (latitude or longitude) or the call number for a book in my library. Without meaning it could be anything.
Symbols and the real world
All around us are myriads of things. We use our senses to perceive them. If we want to recall what we saw at a later date we can use pictures (photographs). We can also describe what we see using words. These pictures and words are symbols for the real things. They are not the things themselves. We choose what goes into the picture and we chose the words we use to describe the things. The pictures and words are never a substitute for the real thing. We have translated our perception into symbols. Data elements are symbols which we use to describe reality on forms, machine readable or otherwise. We describe those data elements to machines, not so that the machines may also perceive them, but to instruct the machines how to store those elements. We document those descriptions so that we may store the data consistently.
In the course of analyzing and designing business systems many different models will be developed and many narratives will be written. In the beginning the models are general and vague. They begin in most cases (those that employ a top down approach) with concepts. These concepts are incorporated into models which are attempt to concentrate a view of reality into charts and graphs so that the participants in the design team - users and developers - can describe and discuss, and agree to a common vision of reality. These charts and graphs, these models depict all of the components of reality as the modelers understand it.
The descriptions of reality are usually as vague and general as the models. Successive iterations of the design process refine the models and provide more detail. They add more and more components, but in many cases the original definitions remain as vague as when they began.
The building of various kinds of models is a foundation for identifying the firm's requirements for data. The models themselves however do not describe the data. They describe the things the firm must collect data about, and they describe how the data elements must be grouped for processing and storage. In most cases they do not describe why that data must be collected, how it must be collected, nor even provide justification for collecting it at all.
The data analysis must describe all of these things if the requirements statements are to be complete. They must also describe how the business requirements are translated into data and data storage rules.
All of these descriptions are narrative. Narratives use words and words have meanings. Narratives explain the meaning behind the data model symbols, and the meaning behind the data elements chosen to describe the objects of interest to the firm.
The data analysis process is iterative. It begins with the identification of the people, places and things of interest to the firm. It also identifies the concepts of interest. It must develop a clear understanding of those things before it can continue. Once those things, those entities are clearly identified, from all of relevant perspectives, their relationships must be examined, identified and documented. The firm must determine why it is interested in those entities and what information it must maintain about them.
The process of building models and developing narratives is one of translation. We translate our perception of reality into symbols. Each model uses different symbols, from boxes and lines on diagrams, through data element lists. Each time we build a different type of model we translate from one set of symbols to another. In order for those translations to be successful we must ensure that the meaning of each symbol is clear and that we understand and are clear as to what we are trying to depict. Entities are not reality. They are symbols however for real things. For the entities to have meaning the real things must be understood. We assign attributes to entities in an attempt to describe them. We assign data elements to attributes to describe the attributes. We assign properties to data elements in order to describe them. Each time we create a different model, using different symbols and we translate the contents of one model into another. In effect, we move from translation to translation. Each time we use a different set of symbols, and try to describe the real things differently. The symbols however cannot adequately describe the things or even the symbols from the preceding model if we do not ensure that adequate meaning is associated with each symbol.
The meaning of models
Each model is developed to describe something or some aspect of the environment. The model is not just a collection of symbols, but is rather a story told without words. Models should be "read" and "readable" in a manner similar to narratives. The model should make sense, and should be consistent. The models should tell the reader what the modeler intended to say. In other words, models are a form of communication. The development of models is a method of communication between developer and user. If both do not understand the meaning of the model, than the model has failed in its role. Models are not developed for the sake of drawing pictures. We build models because they should be able to express our ideas in a clearer and more meaningful manner than words.
In some case we build models because the things we are trying to depict have no reality that can be perceived. We cannot adequately depict a company, nor a student, nor a customer, nor even a vendor. At least we cannot when we are trying to describe the concept of a vendor. To be sure we can describe one student, but are we describing "studentness" or are we describing the person that is the student. We must be clear in what we are describing for it is easy top confuse the thing with the role it plays. It is also easy to associate attributes with things which are mere concepts, such as a company. In some cases we may confuse the thing with its actions, or its representation, or even with the records we keep of it. Is the customer a person or is the customer a set of order records? Is the contractor a person or is it a document describing an agreement between two parties.
We shall see that in most cases we are modeling concepts - companies, customers, contractors, vendors, etc. We shall also see that concepts are not easily modeled, nor even easy to describe. We use concepts and words in many cases without really thinking about what they really mean. The process of data analysis is in part the process of clarifying these concepts to a point that we can accurately and precisely determine what data we need to describe them.
Semantics and Classification
Understanding the meaning of the concepts we are trying to model is critical to the success of the effort. Using terminology with precise meaning to discuss the model components and the model constructs is equally critical. Several concepts must be presented before we can begin to discuss the development of the various kinds of data models.
Categorizing or classifying things is a fundamental process of human existence. The world we live in, business or personal, real or conceptual is composed of myriads of things. Some of these things have very real differences between them, others are somewhat similar and still others are highly similar to each other. The differences and/or similarities between many of these things are sometimes more artificial than real. Distinctions are made between groups of things because it is clearer to do so that it is to refer non-grouped things. One reason from making distinctions between things is to put them into groups which are easily manageable or understandable.
We can see from the above discussion that classification is used for two purposes: to group like things and to separate unlike things.
To classify is to organize, arrange or group things according to family, class or category.
The terms family, class, etc., are biological terms and refer to various levels of specificity or generality when discussing sets, groups, or collections containing members having some characteristics in common. These terms are used in taxonomic charts for biology (where modern classification began) when categorizing flora and fauna and are used in a general to specific sequence. That is, the most general term covers the broadest group of things and the most specific term covers the most specific group of things. The level of specificity of the group is determined by the number of characteristics the members of the group have in common.
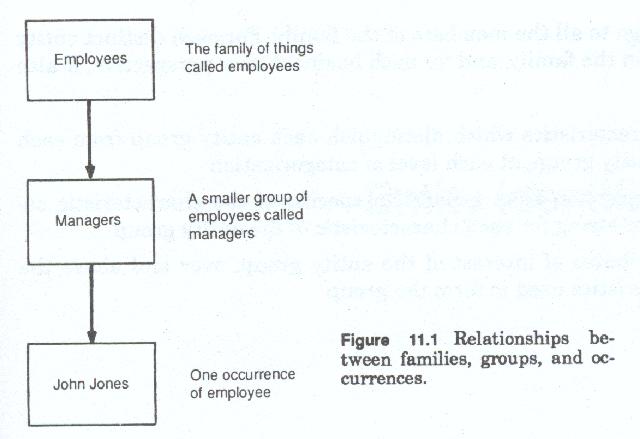
Since the term entity must always be qualified by some adjective or noun, and since the data model must distinguish between groups of entities in the same general to specific manner, and since we must distinguish between a whole group and a portion of that group, we will use the term entity family to refer to the largest, most general group, the term entity group to refer to a subdivision of the entity family and the term entity occurrence or entity instance to refer to a single entity.
The terms class, type, subtype, etc., are frequently, and interchangeably, used to the point where people talk about types, sub-types, sub-sub-types, etc. Although the taxonomic terms of class, order, etc., could have been borrowed as well, they all refer to groups, general groups, specific groups, large groups, small groups, groups within groups, but groups nonetheless. As we shall see later, data classification is not just a general to specific decomposition, and thus it would have been misleading to use terms which implied that it was. Since these terms also refer to level of specificity and commonality of characteristic, and have specific meanings when used in relation to each other, they were discarded in favor of the simple term entity group.
The term family, although below class in the taxonomy charts, has no current usage within data modeling and was chosen primarily for that reason. Thus we now have a set of terms which allow us to identify the whole group, one member of the group, and that which is in-between.
The use of the terms family, group and occurrence (figure 11-1), as we shall illustrate later is more significant since the terms class, type and subtype etc., imply a hierarchic decomposition of an entity in much the same context as the hierarchic decomposition of function and process. In reality although the data model concentrates on the identification of groups within groups (decomposition) it must also account for overlapping groups, and multiple groups decomposed from the same population but using differing characteristics.
Entity Families versus Entity Groups
An entity family is that group of entities with the fewest characteristics in common. The fewer the characteristics that the members of a group have in common, the more members the group can potentially have. Thus an entity family is that group of entities with the largest possible membership since it uses the fewest characteristics as criteria for membership. Entity families are identified in the first phase (usually called the enterprise or conceptual phase) of data model construction and form the components of the conceptual or highest level data model.
In the vast majority of cases the entity families in the data models become the subjects of Subject Area data bases (or entity data bases, files or just data bases). That is, the data about these subject entities is found in the database which corresponds to that subject entity. In this case, where there is a one to one correspondence between entity family and Subject Area data base, the term subject entity is another name for an entity family.
These entity families are general groups of things which are in many cases only loosely related. Because the business processes of the firm usually only deal with selected (or specific) entity groups and need both general (family-wide) data and (group) specific data, the identification of both family and group and the relationship between the two is critical to the effectiveness of the data model.
A data entity family represents a collection of highly interrelated data common to all the members of the family. For each distinct entity group within the family, and for each business user perspective, it also includes:
Data Analysis, Data Modeling and Classification
Written by Martin E. Modell
Copyright © 2007 Martin E. Modell
All rights reserved. Printed in the United States of America. Except as permitted under United States Copyright Act of 1976, no part of this publication may be reproduced or distributed in any form or by any means, or stored in a data base or retrieval system, without the prior written permission of the author.